Jump to…
Self-service data engineering at enterprise scale: ~4,500 production pipelines, ~75B records/day, a platform team that peaked at seven
An anonymized architecture case study of a four-year enterprise data platform built from inside a business org: structural enforcement over vigilance, a single-version invariant with zero breaking changes, evidence-based promotion in a production-replica UAT, and a governed AI operations surface.
Executive Summary
This document describes a self-service data engineering platform built and operated by a small team over four years for a Fortune 50 enterprise. The platform replaced a manual, ticket-driven model with a governed self-service environment in which business users deploy production data pipelines in under a minute, without engineering intervention. It is the latest form of a data engineering practice I built from nothing over seven years inside that enterprise; this case study covers the final four, on the architecture described here.
My role. I owned this platform’s architecture end to end for its four years — every design decision in this document was mine, including what was left out. The one-pipeline-one-table rule, the single-version invariant and the commitment that engineering absorbs every migration, the swap-table safety model, data-aware scheduling with the lineage graph as the orchestration graph, structural cost admission, the logical separation of UAT from production when only one environment existed, and the compromise that made UAT a full production replica while production remained the only environment I guaranteed, the canonical-API deployment model, and the decision to expose the platform to AI operators through the same governed surface humans use — I made those calls and I am accountable for their consequences, including the gaps acknowledged below. A team that peaked at seven engineers executed under my direction; the code, the operators, and the daily operation of the platform are their craft. The architecture, and what it does and does not do, is mine.
The platform supports fourteen fully operational client organizations and several dozen squad-equivalent teams running approximately 4,500 production data pipelines that process around 75 billion records per day — roughly 10,000 pipelines and 150 billion records per day once the full-scale UAT replica the same team operates is included. It is operated by a platform team that peaked at seven engineers and was usually smaller, and the infrastructure bill for the whole estate — on-premise cluster and cloud warehouse, both environments — was roughly $300,000 a year. The resulting leverage ratios — roughly 650 production pipelines and over 10 billion records per engineer per day, computed at the peak team size and therefore understating the typical case — are well beyond anything I have seen on a comparable platform team.
The architectural distinguishing feature is structural enforcement: wherever a problem could be solved either by engineering vigilance or by structure, the platform chooses structure. Cost overruns are blocked at admission, not detected after billing. Observability is attached at the framework level, not requested of users. Dead pipelines retire themselves. Platform upgrades reach all pipelines simultaneously because there is exactly one platform version — and the platform team absorbs whatever migration work that invariant requires.
Leverage Ratios
| Ratio | Value and context |
|---|---|
| Production pipelines per engineer | ~650 — the orchestrated-pipeline teams I have worked with or reviewed sit in the tens to low hundreds |
| Production records per engineer per day | ~10+ billion |
| Users per engineer | ~40 : 1 — tier-1 support is automated into the product, not staffed |
| Source connections per engineer | ~15 — connections are templated, not hand-built |
| Peak production deploys per day | ~130 — engineers do not approve deploys; governance is delegated to the owning teams |
| Breaking changes for users in 4 years | Zero — by structural design; see The Single-Version Invariant |
Platform Context
The platform was built under a specific set of constraints that shaped every subsequent design decision. The architectural choices are not portable without an honest account of what they were responding to.
Where the platform came from
There was no data engineering organization when I arrived. I was hired to do complex analytics and found nothing to do it with. The entire data pipeline was a single stored procedure in the relational warehouse, scheduled by central IT to run at midnight; the analysts’ practice was to write their own procedures and have the main one call them, sequentially, one after another. Every addition made the nightly run longer and more fragile, and nobody owned the whole.
I started by decomposing that procedure and arguing for real tooling. The client provided a desktop analytics product, and we used it for about a year and a half. It was good for an analyst working at a laptop and poor as an integration tool: even with its server edition there was no way to sequence jobs properly, so I built a scheduler around it — batch scripts that wrapped each flow in a pre-load and a post-load step, governed by a control table of job names and predecessors. When that became too painful I wrote a scheduler in Python. The control table stayed in the warehouse; the scheduler sequenced the jobs and triggered the flows. It ran on my laptop until I asked the business unit for a server and was given a virtual machine.
From there it grew into a framework: a Python package for sourcing the raw layer, parallel loads via threading, and a set of automated load patterns — type-2 dimensions, delta, full, and partition loads — plus Python and shell job types, all driven by the same scheduler. Eventually it grew large enough that the client became uneasy about depending on a custom-built framework and asked for an open-source orchestrator underneath it. The move onto that orchestrator is where this case study begins. The load patterns and the predecessor-table lineage predate it; the orchestrator era is where they became a platform.
The constraint set
| Constraint | Implication |
|---|---|
| Business-org placement | No dedicated IT support. Infrastructure access had to be negotiated, not requisitioned. |
| Bare-minimum sponsorship | Capabilities had to prove themselves before earning resource commitments. |
| Zero test-infrastructure budget | No synthetic test suite. Compensating methodology: the UAT environment — a full production replica in data and volume that existed for other reasons — used as the test environment. |
| No network-layer control | Segregated source networks required custom tunneled access built into the connection layer. |
| Multi-cloud by inheritance | On-premise orchestration; cloud warehouse; cloud-resident operational metadata. The topology was available, not chosen. |
| Non-engineer user base | Users write SQL and declarative configuration; they do not write or maintain orchestration code. |
| Team owns everything | Development, support, releases, and access management on the same small team. Self-service had to be the default; capacity for individual requests was near zero. |
Constraint As Architecture — The platform exists in this form because of these constraints, not in spite of them. A platform with central-IT placement, a dedicated test budget, and unconstrained team growth would have ended up substantially different — and likely worse along the leverage dimensions above. The constraints forced structural solutions that headcount or budget would have papered over.
The User Contract
The platform exposes a deliberately narrow contract: analysts describe intent; the platform compiles the mechanics. The one-sentence version: a user writes SQL, clicks a button, and a governed pipeline — orchestration, target schema, deployment, audit trail — is live in production in under a minute.
Two authoring surfaces, no code
Transformation pipelines are authored in SQL. Movement pipelines (historical loads, file ingestion, SFTP, spreadsheet sources) are authored through declarative configuration fields. Both surfaces produce fully governed pipelines without the user writing a line of orchestration code. All 28 pipeline types in the platform reduce to one of these two surfaces.
What users never write
-
Orchestration code — generated from templates at deploy time
-
DDL — inferred from the SQL, generated, queued, approved, and applied by the schema service
-
Configuration files — schedule and orchestration settings are UI-declared metadata
-
Deployment scripts — replaced by the platform’s integrated deployment subsystem
-
Operator wiring — the declared pipeline type determines the operator sequence
What users do write
-
SQL — source extraction statements and transformation logic
-
Declared metadata — pipeline type, schedule, target, partition and delta keys, validation thresholds, ownership
The foundational rule: one pipeline owns one table
The rule came from looking at how other teams used the orchestrator before committing to it. The common pattern was one workflow loading many tables — thousands of lines of Python wrapped around SQL, graphs nobody could read or reason about. I thought the standard approach was wrong at scale, and decomposed it: one job, one table, with the tasks inside the job controlling only how that one table is loaded. The load patterns from the previous framework carried over as the templates; what changed was that each one now produced exactly one governed unit. It is a hard architectural constraint, imposed early, whose consequences cascade through the entire platform — and whose costs were accepted deliberately:
| Benefit | Cost accepted |
|---|---|
| Scheduling simplification — each pipeline owns exactly one piece of state | Pipeline count grows large (~10,000 across environments) |
| Error attribution is unambiguous — one pipeline, one owner, one failure boundary | Scheduler parse load becomes a real scaling concern, requiring parse-time discipline |
| Data flow is point-to-point; no internal pipeline complexity | Library imports and operator design become mandatory craft skills |
| Sidesteps the “one giant workflow that manages everything” anti-pattern that consumes most enterprise orchestration deployments | — |
The rule pays off in places it was not designed for: schema coordination is trivial because no two pipelines contend for one table; lineage is clean because each table has exactly one producer; automated retirement is safe because retiring a pipeline affects exactly one output; blast radius is computable by construction. Several apparent simplifications elsewhere in the platform derive from this single early constraint.
Parse-Time Discipline — At thousands of pipelines per environment, the scheduler re-parses the entire estate every few seconds. If any pipeline definition does meaningful work at module load — opens connections, reads files, queries a database — the scheduler falls behind and the platform degrades. The platform-wide rule: almost nothing runs at parse time. Connections, file handles, and warehouse clients are constructed inside task execution, never at module load. Most teams discover this constraint at 500–1,000 pipelines and retrofit expensively. This platform discovered it too: the earliest instance I remember was database connections opened at class initialization, which the orchestrator’s definition processor — it instantiates every definition on every parse cycle — turned into a hammer on the metadata database. The fix became the rule, and the rule has held since.
The Single-Version Invariant
The platform’s deepest reliability commitment deserves its own section: every pipeline, in every environment, always runs on the same platform version. There is no version matrix, no operator version field, no compatibility negotiation. One platform, one contract, everywhere, always.
The core principle
The Invariant — No platform change should ever result in a data change for the customer. The pipeline a user wrote two years ago produces the same output today, against the same operator contract, without the user ever having known the platform changed underneath it.
This is the platform’s strongest operational claim: zero breaking changes for users in four years of continuous platform evolution. It is not an accident of stability — the platform changed constantly across that period — it is the product of a deliberate three-part stance:
1. No operator versioning
Operators carry no version field. The conventional wisdom says version everything for flexibility; the platform took the opposite position because every version becomes a fork in user knowledge (“which version is this pipeline on?”). Across fourteen organizations and several hundred users, that fork compounds into a support burden far larger than the flexibility ever recovers. There is one platform; every pipeline operates against the same contract.
2. Engineering absorbs the migration
When a change must break the operator contract, the platform team migrates every affected pipeline on the users’ behalf — automatically where possible, by hand where necessary. The scope stays bounded because changes are template-scoped rather than estate-wide. The team has internalized this as part of the platform contract, not as an exceptional event. The cost of the invariant lands on the platform team, deliberately, because the team is the only place it can be absorbed without multiplying.
3. The pragmatic exception
If engineering cannot fix it, the platform does not force it. Sometimes a sub-optimal implementation lives on because migration cost exceeds benefit. The platform is not stable by pretending to be perfect; it is stable by choosing what to absorb and being honest about what it will not.
The combination is another instance of the platform’s defining meta-pattern: structural enforcement over user discipline. Operator versioning is user discipline (“remember what version you are on”). The single-version invariant is structural (“there is one platform; engineering does whatever is needed to keep it that way”).
Environment Model and Evidence-Based Promotion
The platform runs three environments with sharply different roles. Understanding the split is necessary to understand how the platform achieves operational confidence without a synthetic test suite.
The three environments
| Environment | Role |
|---|---|
| Development | Bare environment for smoke testing. Platform changes are validated here first, but the environment deliberately lacks the diversity of jobs and the volume needed to surface real-world failure modes. It answers “does it run at all,” not “does it survive production conditions.” |
| User Acceptance (UAT) | A full production replica — in data and in volume. UAT runs the same job diversity and processes comparable daily volume to production (~75 billion records per day per environment). This is the actual test environment: the place where changes meet production-shaped reality before production does. |
| Production | The governed production estate. Changes arrive only through the promotion workflow, having accumulated evidence in UAT. |
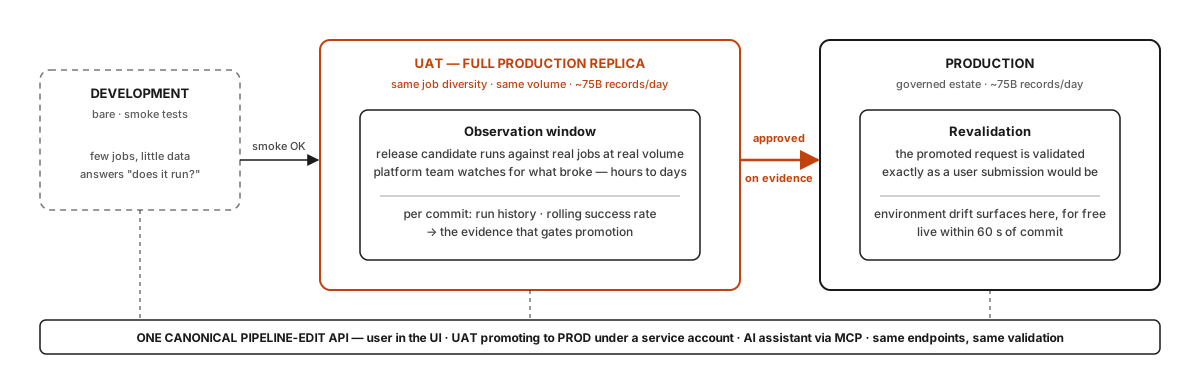
The size asymmetry is the point: development is deliberately small; UAT and production are the same size because UAT is production’s replica. Every actor — user, cross-environment promotion, AI assistant — reaches every environment through one API.
Why UAT is a production replica
The replica was not designed; it was negotiated. At the start there was one environment — production — and business users were developing directly in it, because the organization wanted analytical results in front of senior leadership quickly and a separate environment would have slowed that down. I forced a separation between UAT and production, but it was a logical separation inside the same infrastructure, not a physical one.
The compromise I struck with the business was this: they could keep a full-scale environment for development and for showing fast results, and I would not stand in the way of that. In exchange, I would guarantee only production. Anything that mattered had to be promoted there. UAT would be kept running on a best-effort basis.
That guarantee, not a rule, is what moved work into production. Nothing stopped a team from exposing a UAT dashboard to users, and for a while many did — users could not tell the difference. What created the friction was reliability. When UAT broke, or ran slow, or lost a node, the answer was the same every time: if it is important, it needs to be in production; I will get to UAT as soon as I can. Teams whose dashboards mattered to them moved them. The platform never had the authority to force production deployment, and it never pretended to; it made production the only thing worth depending on and let that do the work. That is the same posture that runs through the rest of the platform — enforce what you can structurally, and refuse to fake what you cannot — applied to the one place where the pressure not to was strongest.
The methodology below is what that compromise turned into once it was in place.
How a platform release is validated
When the platform team prepares a release candidate, it is smoke-tested in development, then deployed to UAT. From that point, the data engineering team observes the platform in UAT: watching the full diversity of real jobs at real volume, looking specifically for what the change may have broken. Because UAT runs production-equivalent workloads continuously, regressions surface within hours-to-days rather than waiting to be discovered in production. Only after this observation window does the release proceed.
Because the replica existed for the reasons above, it could also serve as the test suite the platform never had budget for. Synthetic tests check behavior against constructed data; UAT observation checks behavior against real data, real job diversity, and real volume. The trade-off is acknowledged in Gaps and Acknowledged Debt — development-stage coverage is thin, and the methodology depends on UAT remaining a faithful replica — but at this scale the empirical evidence accumulates faster and catches more than any synthetic suite the team could have afforded to build and maintain.
Per-commit evidence for user changes
The same evidence-based logic applies to user pipeline changes. Every commit is a tracked entity with production-grade telemetry: a visual run history of the most recent executions, a rolling success rate over the last ten runs within thirty days, run counts attributable to the commit since deploy, and side-by-side code comparison against both the previous version and what is currently deployed to production.
Promotion to production is gated on this evidence by the owning team’s designated approvers. There is deliberately no platform-enforced evidence threshold — no rule that says “N successful runs required.” The owning teams see the evidence, own the promotion decision, and bear the consequences. The platform refuses to mediate decisions that belong to the people accountable for the outcome.
Commit attribution and curated diffs
Pipeline runs are joined to the commits that produced them by timestamp within each environment — production deploys generate their own commits, giving each environment a coherent monotonic timeline without carrying commit identifiers through run metadata. The comparison view is deliberately curated: it shows the SQL, the configuration, and the schema-change logs, and explicitly omits the generated orchestration code, because generated pipelines differ only in template parameters and showing them is noise. Showing what is useful beats showing everything.
Runtime Execution and Orchestration
The seven-phase execution flow
Every data pipeline executes through the same seven-phase flow: Cleanup → Extract → Transform → Load → Validate → Swap → Post-Load. Stale staging artifacts are removed; source SQL executes and writes columnar staging files; cleaning and hashing transforms apply multi-threaded; data loads into a dedicated swap table; pre- and post-load quality checks run; the swap table atomically replaces the production table after threshold validation; and delta keys, statistics, metadata, and the freshness state of downstream dashboards update (see Data freshness, surfaced where the user is looking).
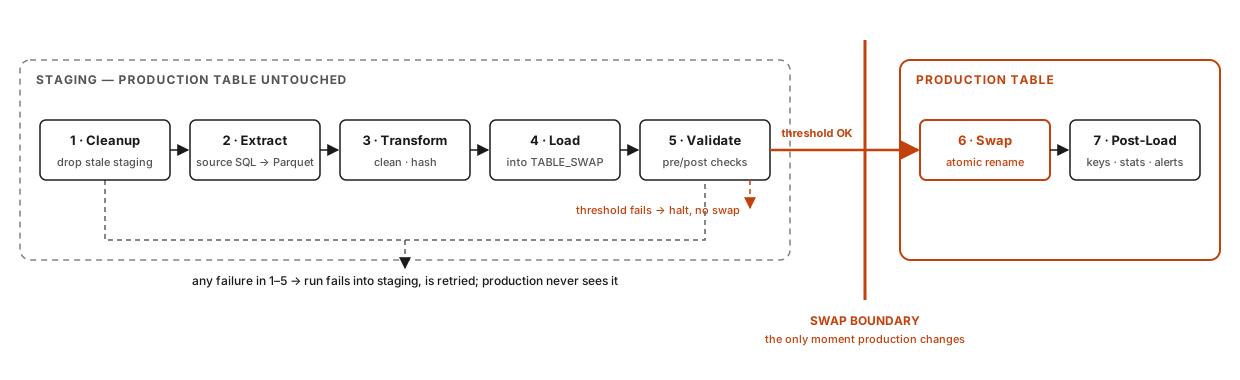
Everything left of the boundary can fail without consequence to production. The boundary is crossed once, atomically, and only after validation passes.
The Swap-Table Safety Invariant — The swap-table pattern is the platform’s primary failure-containment mechanism. Any failure prior to the Swap phase leaves the production table completely unaffected — the run simply fails into staging and can be retried. The atomic swap itself is guarded by threshold validation: a run that would replace a populated production table with a suspiciously small result is halted rather than applied. The entire platform’s reliability posture rests on this invariant: production data changes are atomic, validated, and reversible-by-rerun.
The swap was the platform’s first data quality rule, and it was a reaction to the upstream data, not a textbook. The enterprise’s data lake, which fed much of the platform, was unreliable in every way a source can be: tables partially loaded, tables duplicated, columns shifted, formats invalid. The first rule was therefore blunt — nothing reaches the target table if the staging table is empty, doubled, or broken — and the row-count threshold is the refinement of that rule into something a user can tune per pipeline.
Data-aware orchestration: the lineage graph is the orchestration graph
The pipeline estate does not run on cron schedules stitched together by hand. The default orchestration model is data-aware scheduling: each pipeline declares its source tables; when an upstream pipeline writes its output, every downstream pipeline that depends on that output triggers automatically.
This model is a direct consequence of one-pipeline-one-table. Once every table is its own job, the question becomes how jobs depend on each other, and the orchestrator’s answer is built for dependencies inside a workflow, not across thousands of them. Sensors and cross-workflow triggers were the available tools, and they are what the platform tried first. They worked, and they did not scale: a sensor polls — it wakes, checks whether the upstream job has finished, and sleeps again; nothing pushes it. With hundreds of jobs and several times that many dependencies, the sensors queued behind each other indefinitely and the scheduler fell behind. The pivot came when the orchestrator introduced data-aware scheduling at about the same time. The platform adopted it as a signaling mechanism: an upstream job marks its output as updated — in practice, by writing an empty marker file — and every downstream job that declared that output as a source is triggered. It worked, and the polling went away entirely.
The architectural consequence is easy to miss and significant: the lineage graph and the orchestration graph are the same graph. Most data platforms maintain these separately and they drift apart over time. Here there is one source of truth — the source tables parsed from the user’s SQL become simultaneously the lineage edge and the orchestration trigger. Lineage cannot be stale because the platform would stop scheduling correctly if it were.
Scheduling supports two active modes — pure time-based (cron) and data-aware with an optional time-based fallback as a safety net if an upstream signal misfires — plus a retirement state described below. A hard platform rule now bans polling sensors and cross-pipeline trigger operators outright; the failure described above is why. Schedule cadences in production range from 15-minute windows to monthly.
Soft retirement and automated hygiene
Pipelines can be moved to a Static state: definition, code, metadata, and target table are preserved; only the active scheduling artifact is removed. This serves finite-lifetime workloads — one-time historical loads, migration backfills — where hard deletion would destroy the data (the platform’s schema-coupling invariant ties table lifetime to pipeline lifetime) and continued execution would burn resources for nothing. The artifact survives; the operational burden does not.
Automatic retirement has a specific origin, and it is another case of the platform declining to pretend to an authority it did not have. Because the platform knew every table feeding every dashboard, it could see exactly which tables fed nothing: wasted computation, visible by construction. Leadership would not allow those pipelines to be removed. The tables were used ad hoc to answer questions, the argument went, and some carried accumulated history that nobody wanted to be the person responsible for losing. That was leadership’s call to make, and the platform did not make it for them.
By the time the waste was consuming real resources, the only rule I could enforce without dropping data whose deletion had not been approved was this: if a pipeline is failing and nobody is acting on the failure, it is not important enough to keep running. Any pipeline with no successful runs in 60 days is moved to Static automatically, with an audit entry, reversible by the owner. The definition and the data stay; only the scheduling stops. The rule catches pipelines that have already stopped working and nobody noticed. It does not catch the ones that keep succeeding into tables nobody reads — those are the subject of Gaps and Acknowledged Debt — and it was the best structural answer available under the constraint. What is worth being precise about is which half of the problem is unsolved. The platform knows, at any moment, which pipelines feed nothing; the retirement list exists and can be produced on demand. What it lacks is the permission to act on it. Given that permission, retirement would be a matter of running the list, not building one.
Resource management
Pipelines are automatically assigned to resource pools (memory-bound, I/O-bound, CPU-bound, cloud-bound) based on their declared type. Users never select pools; the template determines the assignment. Pool starvation by misconfiguration is structurally impossible. Execution is distributed across a multi-node cluster with automatic retry of failed tasks on surviving nodes.
Platform Capabilities
The capabilities below are the surfaces user teams interact with day to day. Each is a managed capability the platform team operates; user teams consume them without needing to understand their internals. Together they constitute the self-service experience the leverage ratios above depend on.
Self-service authoring
The authoring environment is a structured web application in which a user defines a pipeline through related forms: source, target, SQL, ownership, schedule, layer. The SQL is analyzed live, with three one-click operations: parse source tables from the query (auto-populating dependencies and lineage), parse source columns from the query (introspecting authoritative column names and types from the source connection itself), and parse target columns from an existing table (for diff-and-align workflows). The platform treats the database as the source of truth for column metadata — the parser handles structural questions like which tables feed this pipeline, while the database’s own cursor metadata answers what the output columns are. Parsers get burned by CTEs, vendor syntax, and dynamic projections; the database’s answer is correct by definition.
Automated schema management
Target schemas are generated and maintained by the platform through a factory pattern that produces dialect-correct DDL for each supported warehouse target. Changes apply asynchronously through a coordination service with a global concurrency cap. Schema-change ordering across pipelines is a non-problem by construction: because each pipeline owns exactly one table, no two pipelines ever contend for the same schema. Execution failures route to the user with recovery options (truncate-and-retry, cancel, reload-and-edit); generation failures route to the platform team via alerting — each failure surfaces to the audience that can act on it.
Governed connections with structural cost enforcement
Connections are not a credential store; they are a governance and cost-control plane. Every connection is typed by role — source, target, or publishing — and a pipeline cannot use a source-only connection as a target. Connections are scoped to organizations, so one team cannot quietly write into another team’s datasets by picking the wrong connection. Tunneled access to segregated networks is embedded in the connection definition itself; operators request a session and transport comes up transparently.
Cost admission was a requirement, not a preference, and it came from the top. Before this platform, the enterprise had learned an extremely expensive lesson on an earlier move to the cloud: an on-premise cluster had been lifted into the cloud as raw compute, without cloud-native services, and the monthly bill reached a figure that became institutional memory. When this platform began its own move to the cloud warehouse, the leadership on both sides — the client’s, which had paid for the lesson, and my own firm’s, which was accountable for not repeating it — was under no illusion about the risk, and I was under direct pressure to make a repeat impossible rather than unlikely. The controls below are the answer to that pressure.
Cost enforcement operates at two gates. At save time, a dry-run estimates the query’s cost — and because the warehouse bills per byte scanned, the dry run returns the exact bytes the query will scan, so the estimate is the bill, not a projection. If it exceeds the connection’s allowance, the save is blocked with a specific error. At runtime, actual usage accumulates against the connection’s budget; when the rolling sum approaches the cap, subsequent runs fail before execution. Budgets are also set per data layer, so an expensive query in a layer that should be cheap is caught even when the organization’s total budget has headroom. The posture throughout: cost overruns are made impossible, not merely observable.
Integrated observability
Every pipeline is observable without user instrumentation. Telemetry capture is attached at the framework level — every operator’s execution is wrapped by instrumentation the user cannot forget to include. The surfaces: per-pipeline run history; a failures monitor with categorized error types and ownership routing; cost dashboards per pipeline, team, and organization; and a real-time process monitor of currently executing work. Failure diagnostics include the error category, the trace, and the last-success timestamp, giving users enough to self-triage before escalating.
Lineage and data catalog
Table-level lineage spans pipelines, sources, and downstream BI consumers, generated automatically from SQL parsing at authoring time. The data dictionary catalogs roughly 170,000 production column-level attributes (about 375,000 across environments) with names, types, descriptions, and ownership. Lineage granularity is deliberately table-level rather than column-level: column-level lineage requires accurate per-column input from users who have no incentive to maintain it, and infrastructure that depends on inputs users treat as a formality produces infrastructure that lies. Table-level lineage that is accurate beats column-level lineage that is aspirational.
There is a second reason, which is practical. The lineage is derived by the platform’s own parsers, and extending them from tables to columns is a large undertaking against roughly 4,200 production tables and 170,000 attributes; the computation alone is borderline intractable at the pace the estate changes. Against that cost stood a question I could never answer yes to for this organization: would anyone look at it? Table-level lineage is consulted every day, by people and by the scheduler. Column-level lineage would have been built for an audience that did not exist.
Data freshness, surfaced where the user is looking
This capability exists because of a complaint, and the complaint deserves stating. A pipeline fails validation upstream; one table stops refreshing; the dashboard that depends on it keeps rendering, now on stale data. Users notice the numbers have not moved, report that the data is not current, and the platform team investigates — which took time, and caused stress on both sides, every time. The platform was in a position to end that cycle because it already owned the one thing the fix needs: the lineage from every source system, through every table, to every dashboard.
The mechanism is a small card in the corner of each dashboard, populated by the platform. Because lineage is table-level and each table has exactly one producer, the platform can compute, for every source system feeding a dashboard, the timestamp of the most recent data from that source to have reached it: system A data as of X, system B data as of Y. The card shows those times. Not every source is worth a line, so the visualization team selectively hides the ones that are not. Alert thresholds are configurable per source — raise an alert if data from this source is delayed more than N minutes — and when a table in the dashboard’s lineage fails, the dashboard says so before anyone has to ask. The last thing every table load does, in the Post-Load phase, is update the freshness state of the dashboards downstream of it.
The same channel carries messages the business teams need in front of users at the moment they open a dashboard — that the calculation of a KPI is being revised to accommodate a business change, for instance — so an announcement reaches exactly the people looking at the number it concerns, when they are looking at it.
The result is that “is this data current?” became a question the dashboard answers itself, and the lineage graph took on a third role: it is the orchestration graph, it is the lineage view, and it is the freshness contract between the platform and every person who consumes its output.
Deployment: one canonical API for every actor
There is no separate deployment pipeline or promotion service. The pipeline-edit API is the canonical surface, and every actor in every environment uses the same endpoints: a user saving a change in the authoring UI, the UAT environment promoting an approved package to production (the same API request, submitted cross-environment under a service account, revalidated by production exactly as if a user had submitted it — environment drift detection comes free), and the AI assistant acting through the MCP surface. On any validation or schema failure, the recovery options are identical regardless of which actor initiated the change.
Distribution is deliberately boring: rendered pipeline definitions land in a version-controlled repository, and every runtime node pulls the repository on a 60-second cycle. No event bus, no fan-out infrastructure. The sub-minute commit-to-production claim is structurally true — it is the polling interval, not an aspiration. Framework code and pipeline definitions live in separate repositories with independent release cadences: the framework releases weekly; pipeline definitions change ~150 times per day across environments, peaking at ~130 production deploys in a single day. A framework release never requires touching pipelines, and vice versa.
AI-assisted operations
The platform exposes an 81-tool Model Context Protocol surface that mirrors the most common user operations exactly. Through it, an AI assistant (Claude) can deploy pipelines from a SQL specification given in conversation, monitor executions, diagnose failures from the telemetry surface, propose fixes, and redeploy — in a single conversational session. The assistant inherits the human’s permission scope through the same API-key mechanism that governs all programmatic access: scoped privileges (read / edit / admin) intersected with the user’s own entitlements. There is no separate AI permission model and no direct database access for the AI; observability flows through the same API humans use.
The surface was not planned as an AI feature. The programmatic API underneath it was built so the platform could be driven without the UI, and when the Model Context Protocol arrived it was a short step from that API to a tool surface an assistant could call. I took the step because it was there to take. The first thing the assistant did on the platform was debug production failures, and the surface was read-only by design. It did not stay that way for long: the pressure to make it read/write came from the business, hard and early, once people saw what it could diagnose and wanted it to fix things too.
Interface Parity, Not Capability Parity — The AI can do what a human can do, through the same governed surface — it cannot do things the human surface forbids. This keeps the AI inside the existing trust envelope rather than expanding it. The most common failure mode of AI-on-platform integrations is granting the AI direct backend access “to make it more useful,” which silently places the AI outside the permission model that governs everyone else. The platform refused that path.
Architecture Overview
Layered view
| Layer | Responsibility |
|---|---|
| User Surface | Authoring web application, observability dashboards, AI assistant interface, programmatic API |
| Platform Services | SQL analysis, schema management, deployment, approval workflow, lineage, data catalog, observability aggregation, MCP tool server, connection management, security |
| Orchestration Runtime | Workflow scheduler, distributed execution cluster, resource pools, operator library, framework-level instrumentation |
| Data Plane | ~100 governed source connections across ~13 platform types, target warehouse, operational metadata store, downstream BI consumers |
Pipeline type taxonomy
The platform supports 28 pipeline types, best understood as target-shape templates plus migration-pattern templates rather than as sprawl. Standard shapes cover full refresh, delta, partition, historical, and delete-capture loads. Warehouse-native variants cover the same shapes executed within the cloud warehouse. A set of migration-pattern types supported a multi-million-dollar warehouse migration spanning ~2,500 pipelines. File-based types cover file drops, SFTP, and spreadsheet sources. Special-purpose types cover dashboard refresh orchestration, AI-augmented pipelines, and automated backload validation.
Operator library
The platform ships 53 custom operators; the only stock orchestrator operators in use are the generic Python and shell wrappers. This is deliberate sovereignty under constraint, not reinvention for its own sake: a custom library reduces the external dependency surface that would require security review the team cannot obtain on its own authority, provides a stable internal API insulated from upstream churn, uniformly encodes platform conventions (logging, retry semantics, connection handling, swap-table behavior, validation hooks), and survives orchestrator version upgrades without breaking thousands of consumer pipelines. The operator library is the mechanism behind the single-version invariant.
Multi-tenancy
Isolation is logical, by design under constraint: warehouse dataset and project boundaries per team, schema boundaries on relational targets, and role-based access control through the organization → team → permission hierarchy in the platform UI. Compute is shared across the execution cluster with resource pools and priority weights as the contention controls. Physical isolation was not available under the platform’s infrastructure constraints; the logical model is stated as the deliberate design it is.
Security highlights
The authentication pipeline is layered: per-channel rate limiting, then token validation with channel binding, then session and privilege resolution. The channel-binding layer is worth singling out: tokens carry a claim recording whether they were issued to the browser UI or to the programmatic API, and a token presented through the wrong channel is rejected. A leaked browser cookie cannot be replayed by an API client; a leaked API key cannot be driven through a browser session. Requests presenting browser credentials pass additional hardening — client-type detection, origin allowlisting, browser-header verification, and a time-windowed cryptographic check — stacked so that trivially-bypassed heuristics are backstopped by cryptographic verification.
The asymmetric rate limits have a date. When the enterprise opened a general-purpose AI assistant to the whole organization, the platform’s backend API was already documented, and the first thing users did was hand that documentation to the assistant and start driving the platform through it. The API was hammered. API keys were issued deliberately and not to everyone, so the users who were refused one asked the assistant for the next best thing: reverse-engineer the browser’s calls and replay them under the user’s own session — reading and writing to the platform through a channel that was never meant to be scripted. The response had to be fast. Browser-channel rate limits came first and hardest; the programmatic API was left more open, as the path we preferred; and once the MCP surface was proven, it became the path we wanted everyone on.
Rate limits are therefore deliberately asymmetric across channels: the browser UI is limited most aggressively, the programmatic API is more permissive, and the AI-assistant channel more permissive still. The threat model is not hypothetical; it is the incident above. Hardening and rate-limiting the browser channel makes that path frustrating, while the sanctioned programmatic paths — which require explicit key issuance with named scopes — remain convenient. The friction was tuned to steer users toward the governed channel, not to stop them: it is placed where the policy violation would otherwise occur, not where the throughput pressure is.
Outcomes and Scale
Scale of operation
| Metric | Value |
|---|---|
| Production pipelines | ~4,500 |
| Pipelines incl. the UAT replica | ~10,000 |
| Production tables | ~4,200 (~9,500 incl. UAT) |
| Catalogued attributes (production) | ~170,000 (~375,000 incl. UAT) |
| Source platform types | ~13 |
| Governed source connections | ~100 |
| BI dashboards | ~200 production (~380 incl. UAT) |
| Squad-equivalent teams | ~45 production (~50 incl. UAT) |
| Operational client orgs | 14 |
| Peak concurrent users | >300 |
| Records / day (production) | ~75B (~150B incl. UAT) |
| Peak month volume (all environments) | ~5 PB |
| Pipeline runs / day (all environments) | ~300k |
| Infrastructure / year (machines and cloud, all environments) | ~$300k |
Caveats accompany the numbers. The platform runs a UAT environment that is a full replica of production in both data and volume, so every “incl. UAT” figure is roughly double the production figure by construction; the production-only numbers are the honest scale, and the combined numbers describe what the team operates. No source-system count is given deliberately: the platform’s declared source-system metadata is entered by analysts, who record the system a table was pulled from (often a shared warehouse or data lake) rather than the system it originated in, or guess the origin when they do not know it — so the declared count is materially inflated and not a defensible statistic. The governed connection count (~100) is the number the platform actually enforces. The team count includes deprecated names never cleaned up. The pipeline count slightly exceeds the table count because the platform auto-generates reconciliation pipelines (backload validation, delete capture) alongside user-authored ones — the one-pipeline-one-table rule applies to user-authored pipelines; system-generated hygiene pipelines add roughly seven percent.
Growth trajectory
Over the most recent 16-month measurement window, the platform processed roughly 40 petabytes while growing approximately 14× year-over-year in data volume. Platform team headcount remained constant across the period. The growth was absorbed structurally, through the architecture documented above, not through team expansion.
During the same period, the platform absorbed a multi-million-dollar warehouse migration: roughly 2,000 tables (about 2,500 pipelines, counting the reconciliation pipelines generated alongside them) moved from a legacy relational warehouse to the cloud warehouse in seven months. The migration team was about fifteen people across analysts, QA, and management — roughly ten tables per working day, or sixty-five a week. That pace was possible only because the legacy pipelines already lived inside the platform: migration was SQL dialect conversion within existing, governed pipelines, not pipeline rewriting. It ran not as a separate program but as a stream of routine changes through the standard promotion workflow; each migrated pipeline used the same deployment mechanics as any other change.
Adoption pattern
The platform expanded from a single sponsor organization to fourteen fully operational organizations through pull, not mandate — and the pull came from two directions, which is worth being precise about. The first organizations arrived through my own firm. It was delivering analytics engagements to other business organizations inside the same enterprise, and its delivery teams had a choice of where to build: the central path, or this platform. They chose the platform because onboarding a new organization took days rather than months, because building against it was faster, and because governance came built in rather than negotiated per engagement. That is pull of a specific kind — practitioners with an alternative choosing the tool that got their client to results sooner — and it is how the platform first crossed organizational lines. The second wave was the client’s own organizations, arriving as word spread: observing a neighbor’s outcomes, requesting onboarding, and being integrated as their use cases justified. The throughput distribution reflects this sequence: the sponsor organization accounts for roughly 65% of total throughput and the top four organizations for roughly 85% — not because the sponsor is dramatically larger, but because it had a multi-year head start. The concentration decreases structurally over time as later adopters grow into their workloads.
Pull-Driven Internal Adoption — Pull-driven adoption inside a large enterprise is rare and harder than either mandated internal adoption or external sales. The adopting organization must admit its current solution is worse, cede control to a platform team it does not manage, and absorb integration cost — without the political cover of an executive mandate. Thirteen organizations followed the first — some through delivery teams that had an alternative and chose this, some on their own initiative; none by mandate. This is the strongest platform-product-fit signal in the operational record, and it emerged from the design rather than from any adoption campaign.
Cost characteristics
The platform’s infrastructure — the on-premise orchestration cluster and the cloud warehouse, for production and the UAT replica together — ran roughly $300,000 a year. That is machines and cloud; people are not in it. The warehouse ran on demand, billed per byte scanned, under the client’s enterprise pricing agreement — under $10 per terabyte at scale. There was no reserved capacity, and not for a technical reason: a reservation had to be requisitioned through central IT, and the business sponsor did not want to push for it. On-demand was the price of staying inside the business organization’s own authority, the same trade that shaped the rest of the platform’s constraints.
The achievement is not unusually low unit cost, which mostly reflects warehouse pricing; it is cost predictability at scale. Scanned-bytes pricing has a property the platform leaned on: the cost of a query is known exactly before it runs. The dry run that gates every save returns the bytes the query will scan, and that number is the charge. Admission control is therefore deterministic rather than heuristic — a query that would breach its allowance is refused with the figure that would have appeared on the bill — and the runtime budget accumulates real charges, not projections. The runaway-query failure mode that makes warehouse spend unpredictable in most deployments cannot occur, because the expensive query never starts.
Budget authority and control authority were deliberately split. The sponsoring business organization held the budget, and it was frugal by disposition: increases had to be earned. I set the controls and quotas — per connection, per layer — and supplied the growth forecasts the budget was adjusted against. That put the person who could see the workload in charge of the limits and the person paying in charge of the total, and it meant the cost controls were never a platform-team preference imposed on users; they were the mechanism by which a frugal sponsor’s budget held while volume grew 14× over the measurement window. Spend did not grow in proportion, because structural enforcement kept inefficient queries from ever running and automated retirement kept dead pipelines from scanning anything at all.
A deeper framing worth stating: cost-per-terabyte is the measurable denominator, but the meaningful one is cost per analytical outcome. A ten-terabyte table nobody consumes costs the same per terabyte as a one-terabyte table that drives a critical business decision. The platform’s pull-driven adoption acts as a value filter — every workload exists because a team requested it to produce a specific output — and the platform’s proximity to the business keeps the question “is this table actually doing work?” answerable. Volume-optimized infrastructure cannot ask that question; outcome-density is structurally invisible to it.
Gaps and Acknowledged Debt
A complete picture includes what the platform has not solved. Six gaps, stated plainly:
No synthetic test suite
Development-stage validation is smoke-level only; the development environment deliberately lacks the job diversity and volume to surface real failure modes. The compensating methodology — release-candidate observation in the production-replica UAT environment — catches behavior against real data at real scale, but it catches it after deployment to UAT rather than before. Future-shape edge cases can still reach UAT before being caught. This is the most likely source of decay over the coming years and was a deliberate trade against a test-infrastructure budget that did not exist.
Idempotency as discipline, not invariant
Operator idempotency is an engineering convention. When a node dies mid-task with a partially-written swap or staging artifact, recovery depends on the operator author having implemented cleanup correctly. Modern dataflow frameworks enforce idempotency as a first-class property; this platform treats it as craft. Violations are discovered by failure rather than prevented by construction.
Cross-cloud metadata latency unmeasured
Latency between the on-premise orchestration runtime and the cloud-resident operational metadata store works well empirically but is not formally instrumented. The accurate characterization is empirical, not measured.
Bus factor
A team that peaked at seven engineers owns roughly 10,000 pipelines across production and UAT and 53 custom operators. Concurrent departure of two senior members would sharply reduce velocity. Documentation depth and distributed operator ownership are continuing investments, not solved problems.
Abandoned-flow accumulation
The platform processes pipelines that succeed reliably but produce output nothing downstream consumes. Automated retirement catches pipelines that stop succeeding; it does not catch dead-output pipelines that keep succeeding. The telemetry to detect dead-output flows exists — the lineage shows which tables reach no dashboard, and downstream query rates and downstream pipeline reads are captured — and a cleanup mechanism could be built on it. Leadership declined it: the tables are used ad hoc, and some hold history nobody wants to be the one to lose. The diagnostic capability exists; the prescriptive authority does not, and the automatic-retirement rule described under Soft retirement is the part of the problem that could be solved without it. This is a sharper instance of a pattern that runs through the platform’s governance design: structural solutions operate only where authority permits them to.
User-feedback ceiling
The primary quality-feedback signal is user reports. This is tractable at several hundred users and would not be at a thousand. Contract testing, schema-difference monitoring, and automated anomaly detection are the natural next investments; the platform is not currently making them.
Architectural Thesis
The platform supports a broader thesis about how enterprise data work should be organized. The case study above is the evidence; the five principles below are what the evidence demonstrates.
Principle 1 — Lower the barrier; empower the business to do its own development
The people who understand the data should be able to operate on it. Most enterprise architectures route business analytical work through central-IT ticket queues, producing multi-week turnarounds for changes the requester could make in minutes with the right tooling. The platform demonstrates that the gap can collapse to sub-minute deploy without losing governance — by automating the mechanics, not by removing the rigor.
Principle 2 — Business owns analytical data; central IT owns centralized infrastructure
The boundary runs between what benefits from proximity to the business and what benefits from centralization. Analytical transformation, semantic interpretation, business rules, and product-specific shaping belong with the business unit that uses them. Raw storage, warehouses, lakes, retention, durability, and platform-level security belong with central IT. Most enterprises fail in one of two directions: central IT owns everything and becomes the bottleneck, or business owns everything and infrastructure becomes uncoordinated. The boundary is the design decision.
Principle 3 — Business value flows back through a publishing layer
When business analytical work produces something the broader enterprise should consume, it must flow into a structured data-product layer — here a medallion publishing tier; the pattern works under other names. The publishing layer is the contract: business owns production logic, the enterprise consumes published artifacts, central IT operates storage and access. This is the structural answer to the federated-ownership problem that most data-mesh initiatives encounter and few solve.
Principle 4 — Accountability follows creation
If business produces it, business maintains it. The platform makes maintenance cheap — templates, factories, structural enforcement, built-in observability — but not optional. Most decentralization initiatives fail here: business builds, business walks away, central IT inherits maintenance without owning logic. The platform refuses that failure mode structurally: the team that creates a pipeline owns its operational lifetime through automated retirement, per-commit evidence, and team-routed approval.
Principle 5 — The middle analytical compute is irreducible
The most common simplification attempt in enterprise data architecture — route data directly from system A to system B and skip the analytical layer — is almost always wrong, for a non-obvious reason. Analytical outputs are not transport; they are compounding institutional knowledge about how upstream systems should be interpreted together, accumulated over years and encoded as derived datasets, lookup tables, attribution rules, and reconciliation logic. The ~170,000 catalogued production attributes in this platform are not fields; they are the materialized result of years of people determining what those fields mean and how they relate. When sustained analytical findings show that upstream systems should change, the analytical layer is where the evidence for that change accumulates — but the layer itself remains load-bearing, not overhead to optimize away.
The shape of the answer
A platform layer that lets business units do their own analytical development at sub-minute deploy velocity, with structural governance that keeps the platform team out of the per-deploy critical path, publishing results into a federated data-product layer operated as infrastructure. This case study is working evidence that the model holds at 75 billion production records per day (150 billion including the UAT replica), fourteen client organizations, and several hundred users — with a platform team that never exceeded seven engineers.
The reason this model is rarely replicated is not a tool gap or a budget gap; it is a placement-and-incentive gap. A platform optimized for business velocity has to be built where the work is, under the constraints the work imposes, by a team accountable to the business outcome rather than to a review cadence — and few organizations place their platform teams that way.